
How to Install Grafana on Debian
Grafana is an open-source multi-platform monitoring solution. You can configure it to display and visualize data from a wide range of data sources in a cool customizable dashboard. It provides several visualization options such as heat maps, charts, histograms, and alerts.
In this post, we are going to describe how to install Grafana on Debian 11 “bullseye”. You can also follow this procedure on previous Debian releases.
Note that you will need sudo privileges in order to install Grafana on your Debian system.
Installing Grafana through Apt Repository
Grafana is not included in the Debian repositories. To install Grafana on Debian, we will need to add the Grafana repository. This is the recommended method for Grafana installation as you can get an updated version of Grafana by running the apt-get update command whenever a new version is released. Let’s start the installation procedure.
1. Install some prerequisite packages through the commands below:
$ sudo apt install -y apt-transport-https
$ sudo apt install -y software-properties-common wget
2. After that, run the command below to download and add the repository key for Grafana to the apt sources keyring:
$ wget -q -O - https://packages.grafana.com/gpg.key | sudo apt-key add -
3. Add the Grafana repository to the list of configured APT data sources through the command below:
$ echo "deb https://packages.grafana.com/oss/deb stable main" | sudo tee -a /etc/apt/sources.list.d/grafana.list
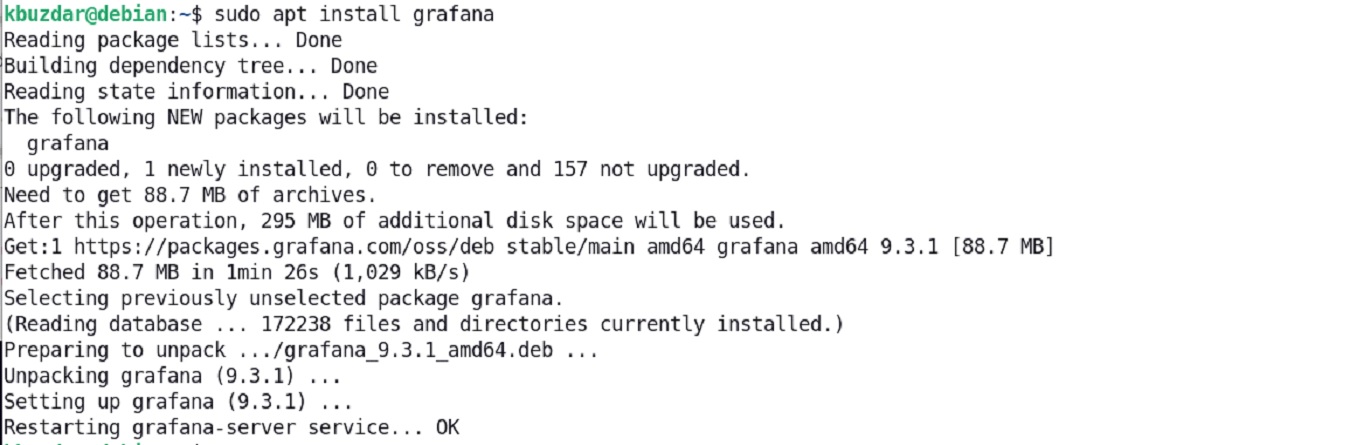
4. Then update repositories and install Grafana:
$ sudo apt-get update
$ sudo apt-get install Grafana
This should install Grafana on your Debian machine.
Installing Grafana through the deb file
You can also install the latest version of Grafana OSS using the deb package provided by the Grafana official website. The latest version of Grafana available on the website is 9.3.1 which is released on December 2, 2022. Let’s see how to install it in the Debian system:
1. First, install some prerequisites using the below command in Terminal:
$ sudo apt-get install -y adduser libfontconfig1
2. Then use the below command to download the Grafana OSS 9.3.1 from the command line:
$ wget https://dl.grafana.com/oss/release/grafana_9.3.1_amd64.deb
You can find the downloaded package grafana _9.3.1_amd64.deb in your Home folder.
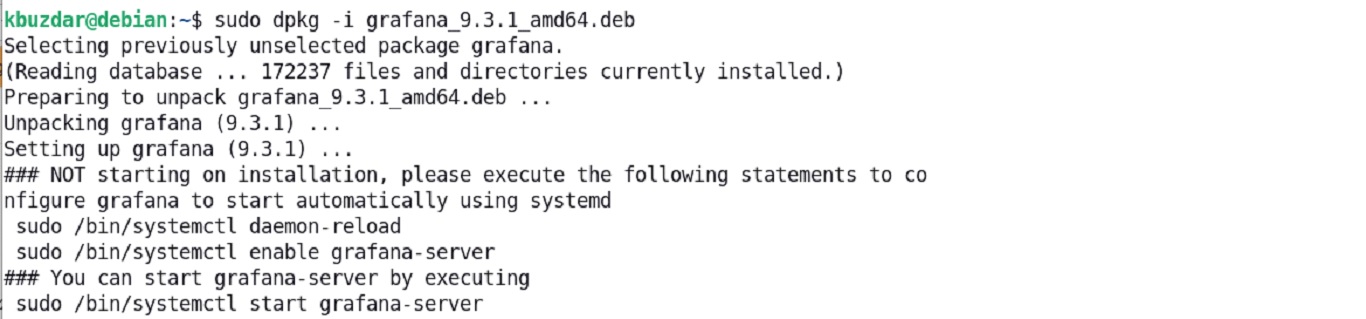
3. Now run the below command to install the grafana _9.3.1_amd64.deb package on your Debian system:
sudo dpkg -i grafana_9.3.1_amd64.deb
This should install Grafana’s latest version on your Debian machine.
Installing Grafana through tar.gz binary
Grafana is also available for installation through standalone Linux binaries. Here’s how you can install Grafana through tar.gz binary:
1. Download Grafana tar.gz binary file using the below command:
$ wget https://dl.grafana.com/oss/release/grafana-9.3.1.linux-amd64.tar.gz
2. Then use the below command to extract/unzip the archive:
$ tar -zxvf grafana-9.3.1.linux-amd64.tar.gz
This command will extract the archive into the grafana-9.3.1 folder in your current directory. The grafana-9.3.1 folder includes all the necessary files that are necessary to run Grafana.
Start and Manage Grafana Services
After installation, you can start the Grafana service using the below commands:
$ sudo systemctl daemon-reload
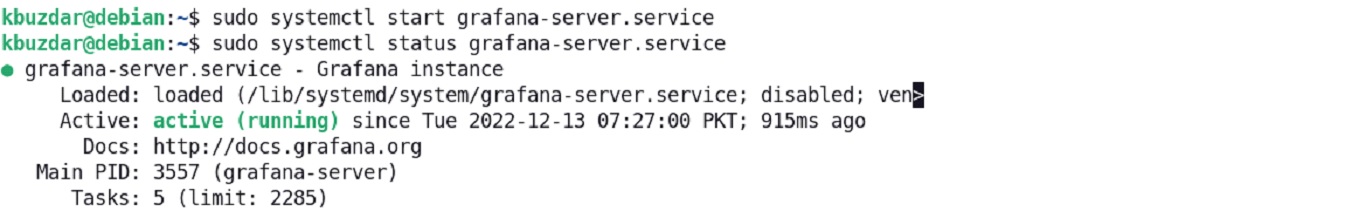
$ sudo systemctl start grafana-server
Then to verify if the service has started successfully, use the below command:
$ sudo systemctl status grafana-server
You can also enable Grafana service to start at system boot:
$ sudo systemctl enable grafana-server
For the Grafana installation through the binary file, use the below commands to start the Grafana service.
Move inside the Grafana-9.3.1 directory using the cd command:
$ cd Grafana-9.3.1/
And run the below command to start it:
$ sudo ./bin/grafana-server web
Login to Grafana
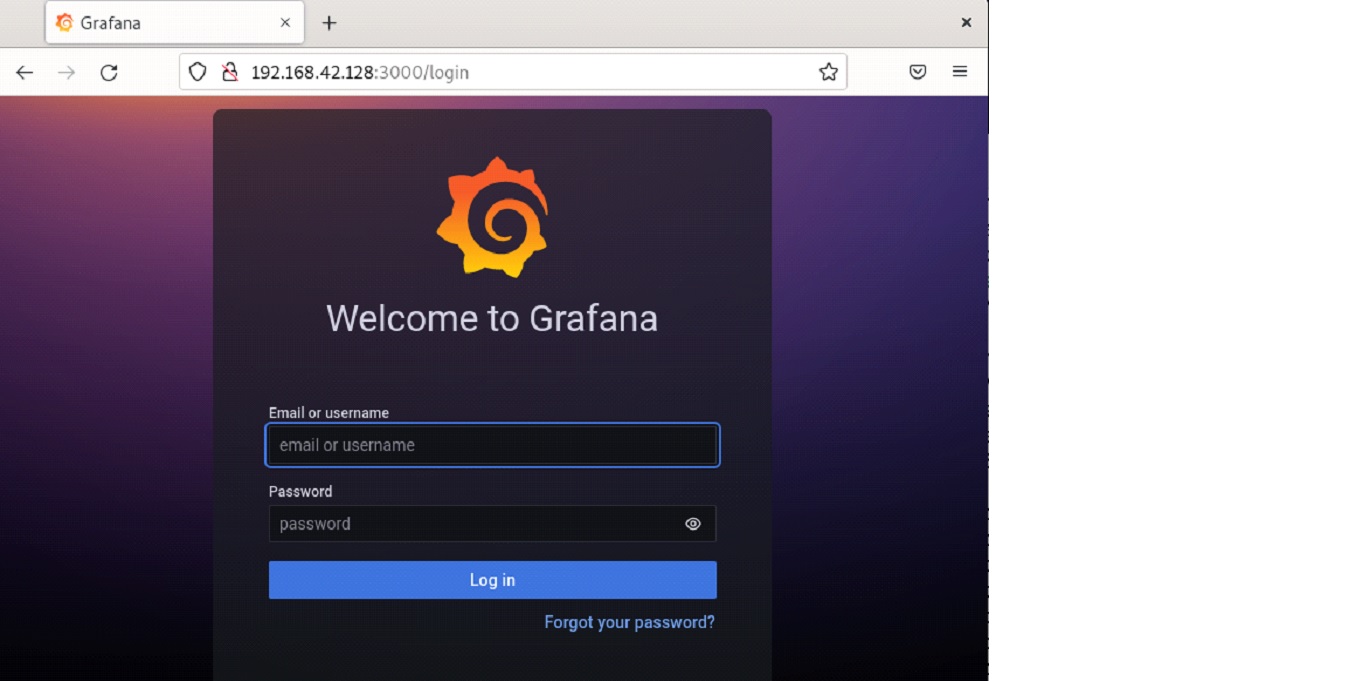
To log in to Grafana, open its webpage using the following address in the address bar of any web browser:
http://<ip-address-of-grafana-server>:3000
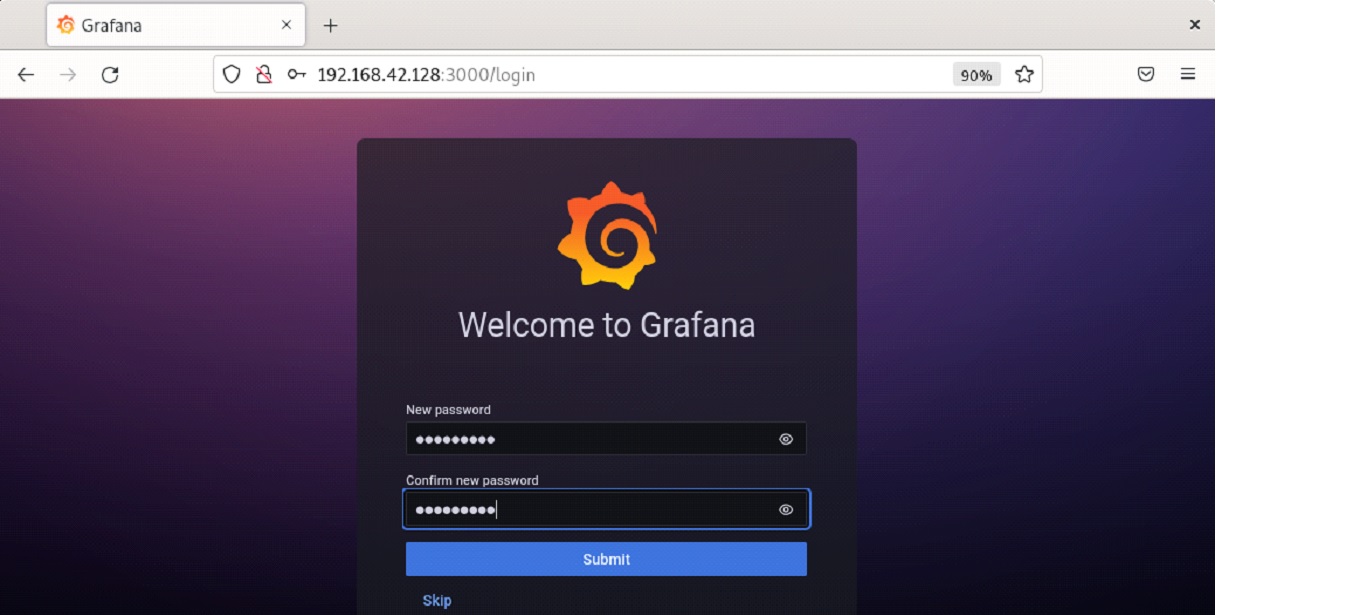
Login using the default username and password that is admin.
Then type a new password and type it again to avoid a typo and click Submit.
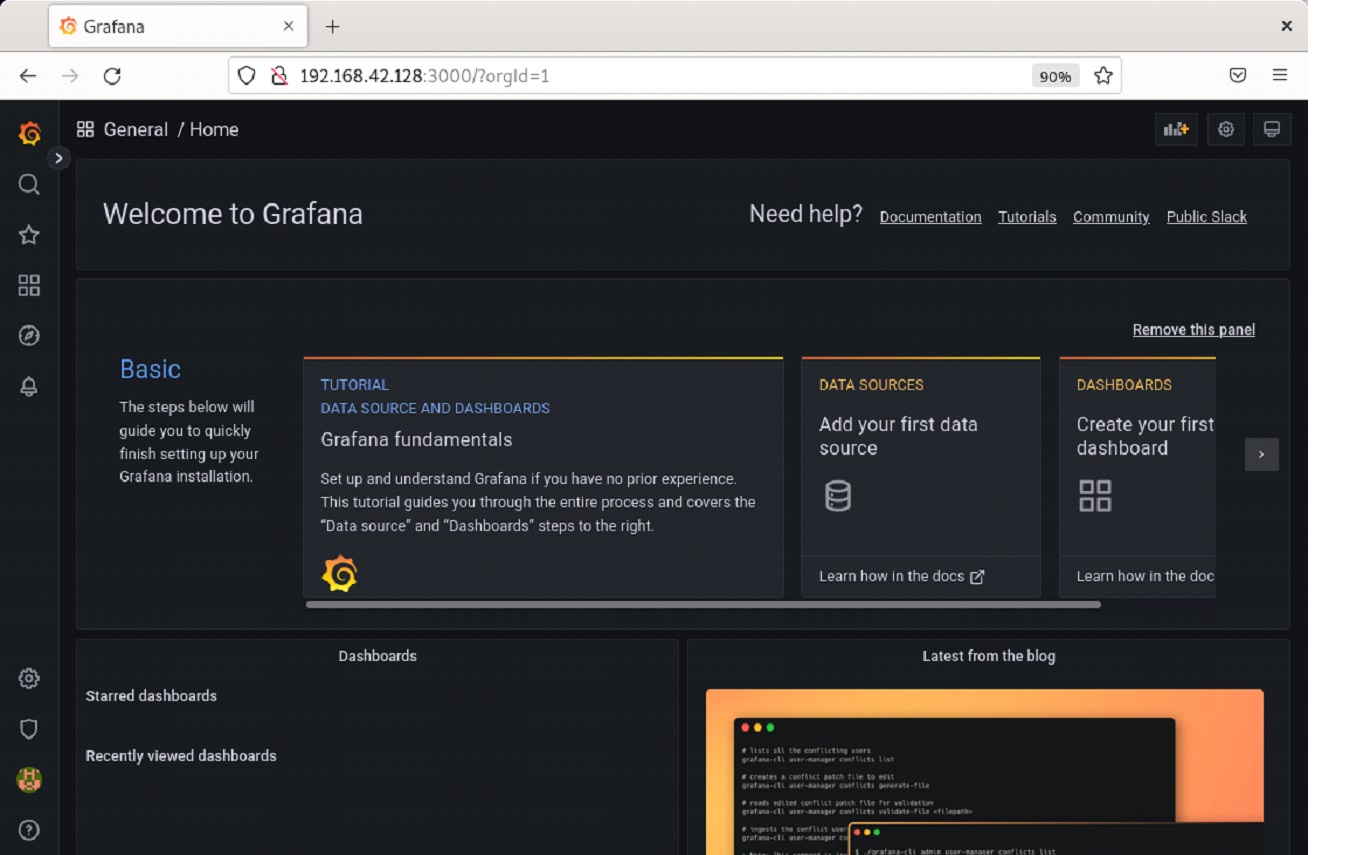
This is the default Grafana dashboard that you will see after logging in.
This is how you can install Grafana using any of the installation methods discussed here. After installation, you can start using Grafana by adding data sources and building your own dashboards. Other than Grafana, there are plenty of other monitoring tools that can help you to efficiently monitor and manage your network.
